Simple Interpolation

Questions and postings pertaining to the usage of ImageMagick regardless of the interface. This includes the command-line utilities, as well as the C and C++ APIs. Usage questions are like "How do I use ImageMagick to create drop shadows?".
Post Reply
dholcomb9711
Posts: 16
Joined: 2018-06-08T03:45:59-07:00
Authentication code: 1152

Simple Interpolation

Post by dholcomb9711 »

Hi everyone. I have been using IM for about a week now on a project. I am downloading NEXRAD doppler radar files from the weather service, decoding them and saving to .TIF using the decoding tools.

My images are looking great, but I am wanting to "pretty" them up some for viewing. I suppose I am looking to interpolate them, but you would not believe how much of a noob I am when it comes to image processing. So far, I have been unable to use the interpolate command do do anything. I am probably doing it wrong, or if I am doing anything it's hard to tell the difference. Commands work but I just don't know where to start really. I am looking for general advice to get me started. (Edit: I have been using -transparent and -resample with awesome results, so I understand the very basic concepts of IM)

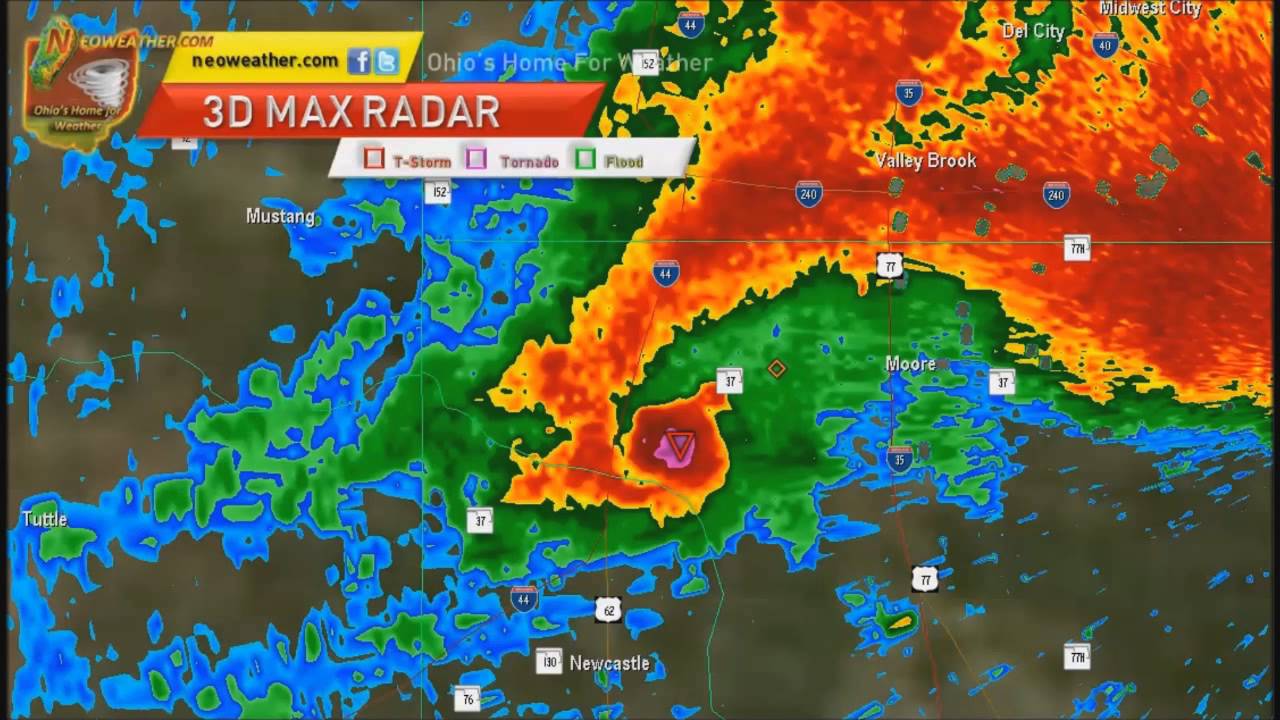
I downloaded a nice storm with a tornado (location in the pink hue area) to test against another image with the same data and time:

Image


This is the storm in the same position and same time, but heavily edited to look pretty : (I used IM to remove the blue pixels from mine, which is why his has blue and mine doesn't. The software that interpolated this image and displayed it was GR2Analyst)

Image

If someone could type out a whole command here to get me on the right track, (a base some some sort I could copy and paste) I would very much appreciate it. I just need to understand how to get started. I am not the best with reading all the complex inputs I see in the interpolation section of the documentation, I seem to get easily confused with it. Again, thank you for any help and I will check back here tomorrow.
snibgo
Posts: 12159
Joined: 2010-01-23T23:01:33-07:00
Authentication code: 1151
Location: England, UK

Re: Simple Interpolation

Post by snibgo »

I can see three differences:

1. Your chart is blockier.

2. Your chart has colours that change more smoothly.

3. They might represent the same time and place, but I think the scales are different.

Each block is about 8.5 pixels wide and high. A blur sigma around 4 removes the blockiness:

Code: Select all

magick n35kjo.jpg -blur 0x4 out.png
Adjust the sigma to taste. The neoweather.com chart is around 6. You should use JPG as input only if you have nothing better.

The other main difference is that the neoweather.com chart uses a different palette of colours, so there are definite boundaries between dark blue and light green, and between dark green and yellow.

It's hard to say from this example, but the colour effect might be that where the colour is green in your example, the neoweather chart has inverted the tonality, so dark green becomes light green, and light green becomes dark green. This could be done by creating a hald-clut ("Colour Look-Up Table") that changes the green as required. The hald can be created once, then re-used for each new chart.

Create the hald:

Code: Select all

magick hald:8 {some_processing} weather_hald.png
Use the hald, as well as the blur:

Code: Select all

magick n35kjo.jpg -blur 0x4 -hald-clut weather_hald.png out.png
snibgo's IM pages: im.snibgo.com
Post Reply